Optimising Sustainable Bamboo Forest Mapping and monitoring techniques with Open-Source Remote Sensing and AI
Bamboo has high ecological and economic value in tropical and subtropical regions of Gujarat. Many species of bamboo are found in five forests of Gujarat, out of which only two species (Dendrocalamus Strictus (Vernacular name is Manvel) and Bambusa arundinacea (Vernacular name is katas)) are industrially important. The total area of bamboo vegetation forms 3% of the state’s total geographical area, among which gregarious flowering bamboos are reported in Narmada, Dangs, and parts of Tapi, Surat, and Valsad districts of South Gujarat.
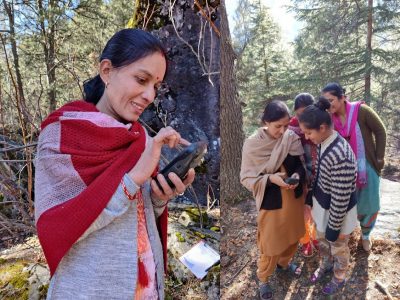
The process of monitoring bamboo growth has improved over the years though it started back in the 1990s in India. Collecting accurate data for BIPP-ISB team on the field was challenging as bamboo grass is usually mixed with other vegetation in thick forests. Bamboo can now be digitally isolated from forest canopy using satellite images by applying multiple image processing techniques. This is done by analyzing the spectral, texture and shape characteristics of the image data. These techniques can differentiate the unique spectral signature of bamboo from other vegetation in the forest canopy. This information can then be used to create maps of bamboo distribution and quantify the bamboo biomass. Accurate inventory is essential for planning and managing a supply chain right from the first stage. Due to the importance of accurate data, the measures and methods have changed, increasing the accuracy in a 3D format leading to Remote Sensing (RS) technology through satellite images and Machine Learning (ML) usage in recent times. The ML technology provides spatial imagery or bamboo properties patterns to increase the accuracy of identifying bamboo plants in the RS data. The use of AI ML techniques to assess satellite images allows for large scale and remote monitoring of bamboo populations, providing valuable information for sustainable forest management.
The team conducted the bamboo inventory mapping using their temporal properties via RS technology. We preferred this method due to the characteristics of bamboo grown in Narmada – not evergreen, grow in clumps, naturally grown, and mixed with other LULC. With bamboo spectral signatures (i.e., from multispectral RS), classifying them among neighboring LULC classes using object-based methods was possible.
The integrated RS-ML monitoring and assessment approach:
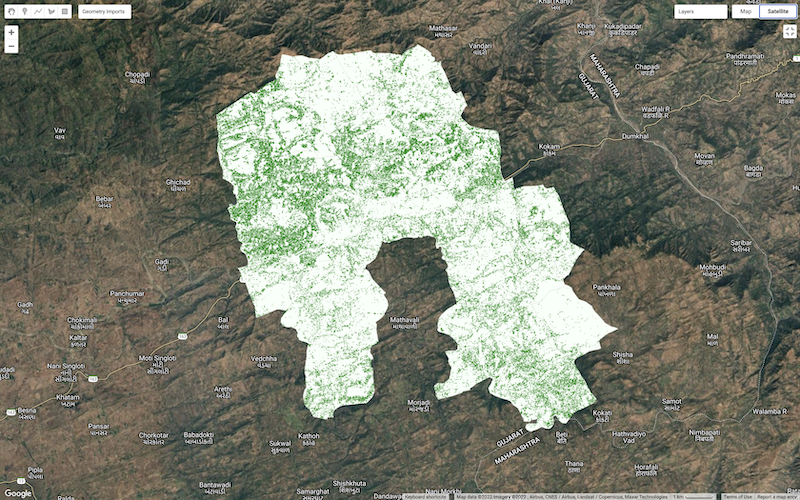
To accurately map through the challenges of heterogenous landscapes and cloud cover while providing backscatter signals of the landscape, sentinel-2 and sentinel-1 commissioned by the European Space Agency were helpful. Pixel-based fractional cover methods were used to create minuscule maps of bamboo per unit area and accurate volume in a bamboo-rich region of the Narmada district.
We aimed to demonstrate and establish methods to upscale bamboo maps nationally, assess the growth and distribution of bamboo in upland and lowland landscapes, and quantify the bamboo volume in the area.
For the purpose of our analysis, we have considered bamboo with the diameter class greater than 5 cm, age greater than 1 year and height greater than 3 m as harvest-ready bamboo. Based on the location data obtained from the field survey and points labels with above class attributes, geostatistical regression is carried out to estimate percentage of bamboo that can be harvested from each 100 m grid. The classification accuracy of RF model is 92% and is consistent over multiple iterations.
RS inputs define the LULC sections and a Geographic Information System model during mapping. The data was split for training and validation of the models, along with bamboo mapping from random forest classification. We compared the validated data per hector basis using mean square error and mean absolute error accuracy metric indices. A similar validation procedure was applied to upland and lowland sites. Lastly, we compared the bamboo volume using Monte Carlo simulations to calculate bamboo density and regional bamboo map distribution from the field inventory data.
After analyzing data using various methods, we noticed a decline in value in the months of mid-June-late-July and mid-August to mid-September across three consecutive years. In the analysis done for calculating density, we got the result of a low density of bamboo in the year 2021.
Detailed analysis is in progress and more data sources are being explored to enhance the information availability in terms of harvest volume and moisture-based conversion factor.